Overview
The Diagnostics page allows you to issue diagnostic commands to the selected Mako and then view the diagnostic results.
To execute the “WAN Health” diagnostic command, click its radio button in the Command column of the list. The diagnostic results will appear above the list.
WAN Health
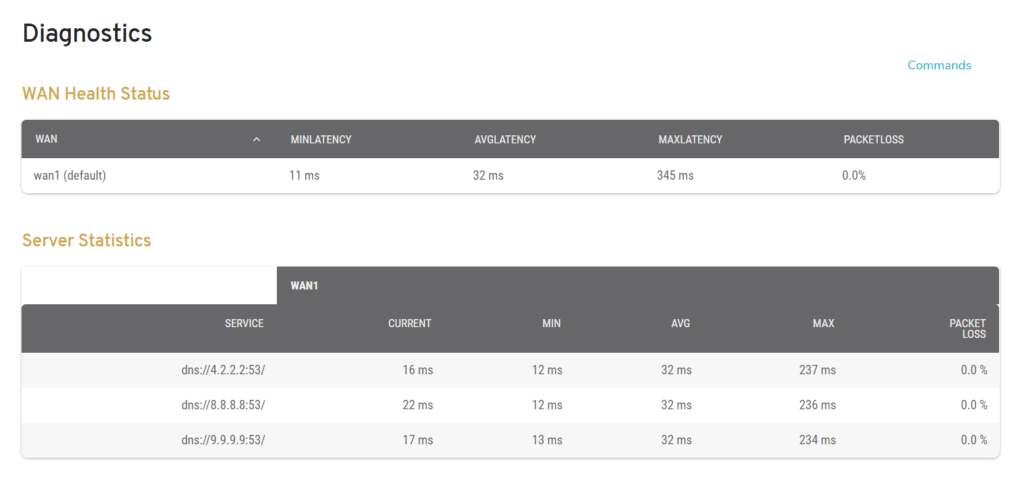
Figure 1. Example “WAN Health” Diagnostic Results
The “WAN Health” diagnostic results (Fig. 1) include the performance of each WAN on the selected Mako and of their connections to certain Mako servers.
WAN Health Status
The WAN Health Status list displays the performance of each active WAN.
Columns
- WAN – name of WAN
- Min Latency – minimum latency duration observed for WAN
- Avg Latency – average latency duration observed for WAN
- Max Latency – maximum latency duration observed for WAN
- Packet Loss – percentage of packets sent across WAN that failed to reach their destination
Server Statistics
The Server Statistics list displays the performance of each active WAN when connecting to certain Mako servers.
Columns
- Service – IP address/name of server
- Current – most recent latency duration observed when connecting to server
- Min – minimum latency duration observed when connecting to server
- Avg – average latency duration observed when connecting to server
- Max – maximum latency duration observed when connecting to server
- Packet Loss – percentage of packets sent across WAN that failed to reach server