This topic is ONLY relevant to security gateways. It is NOT relevant to managed switches.
Overview
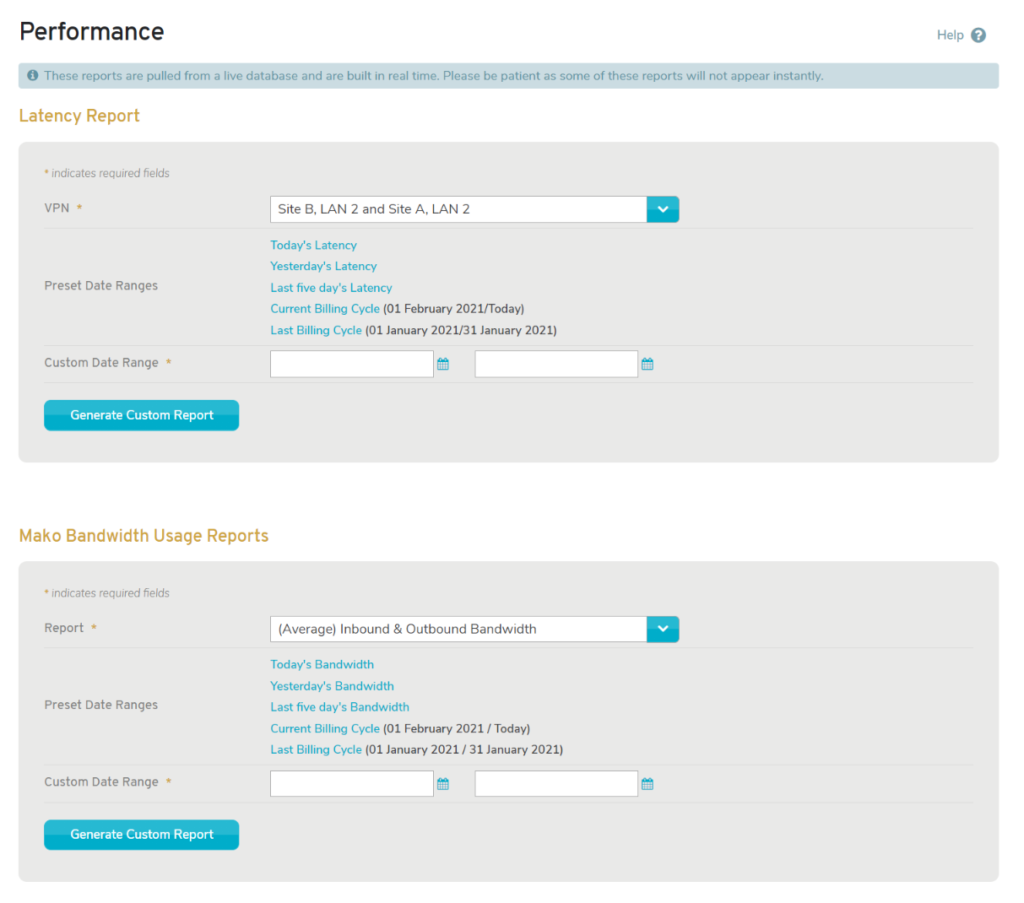
Figure 1. Example Performance Page
The Performance page (Fig. 1) allows you to view and generate performance reports.
These reports are generated from a live database in real time and may not appear immediately. Please be patient.
Latency Report
The Latency Report is currently deprecated.
Mako Bandwidth Usage Report
Mako Bandwidth Usage Report Form
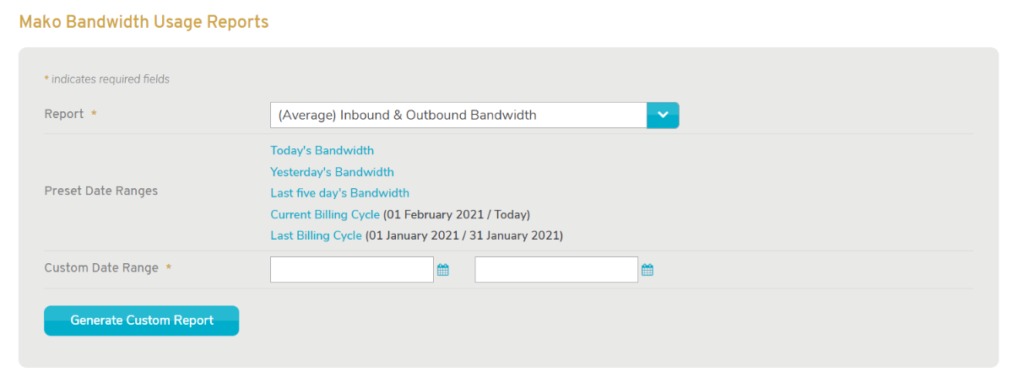
Figure 2. Example Mako Bandwidth Usage Report Form
The Mako Bandwidth Usage Report form (Fig. 2) allows you to search for specific types and date ranges of Mako bandwidth usage.
Report Type
Choose the type of report that you want to view using the Report dropdown. The following options are available.
- (Average) Inbound & Outbound Bandwidth
- (Max) Inbound & Outbound Bandwidth
- Inbound Bandwidth Throughput
- Outbound Bandwidth Throughput
Date Range
Either choose a preset date range using the provided links to filter the report, OR specify a custom date range using the starting and ending date fields below the links.
- Today’s Bandwidth
- Yesterday’s Bandwidth
- Last five day’s Bandwidth
- Current Billing Cycle
- Last Billing Cycle
If you have specified a custom date range, click the “Generate Custom Report” button to open the results in a new window.
Mako Bandwidth Usage Report Chart
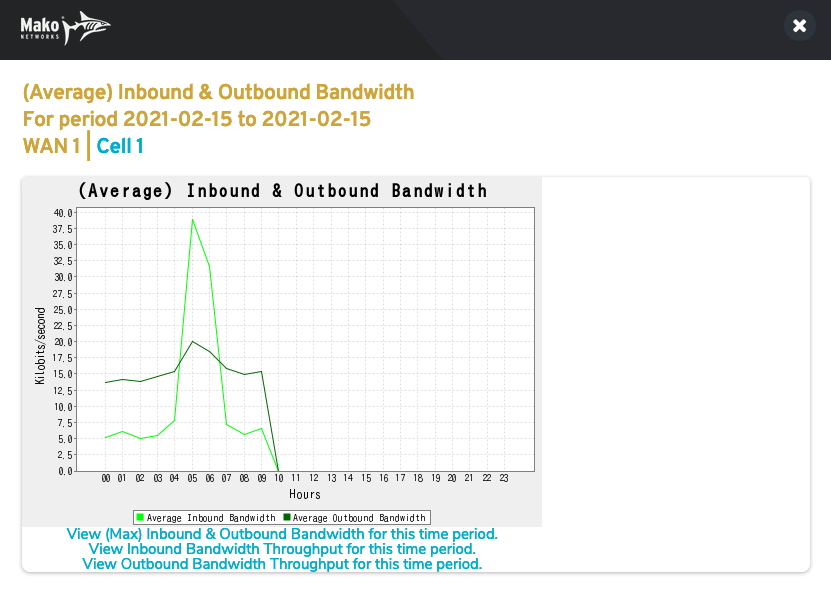
Figure 3. Example Mako Bandwidth Usage Report Chart
The Mako Bandwidth Usage Report chart (Fig. 3) displays Mako bandwidth usage data for the selected Mako that matches the search criteria used to generate the report.
Use the filter links at the top of the chart to view an individual WAN or Cell’s usage by clicking its named link.
Use the links at the bottom of the chart to change the report type.