Overview
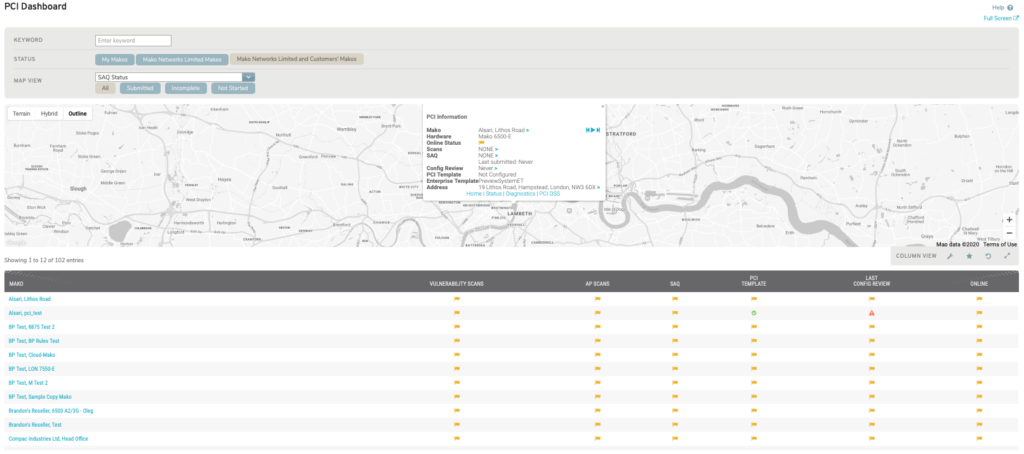
Figure 1. Example PCI Dashboard Page
The PCI Dashboard page (Fig. 1) provides advanced visualization options for reviewing the PCI status of your Makos.
Some features shown here are only available with Mako’s Merchant PCI services. See the PCI DSS Summary documentation for details regarding Merchant PCI services. You must have both an active PCI DSS License and an active PCI Enhanced Services License in order to access Merchant PCI services.
PCI Dashboard Map
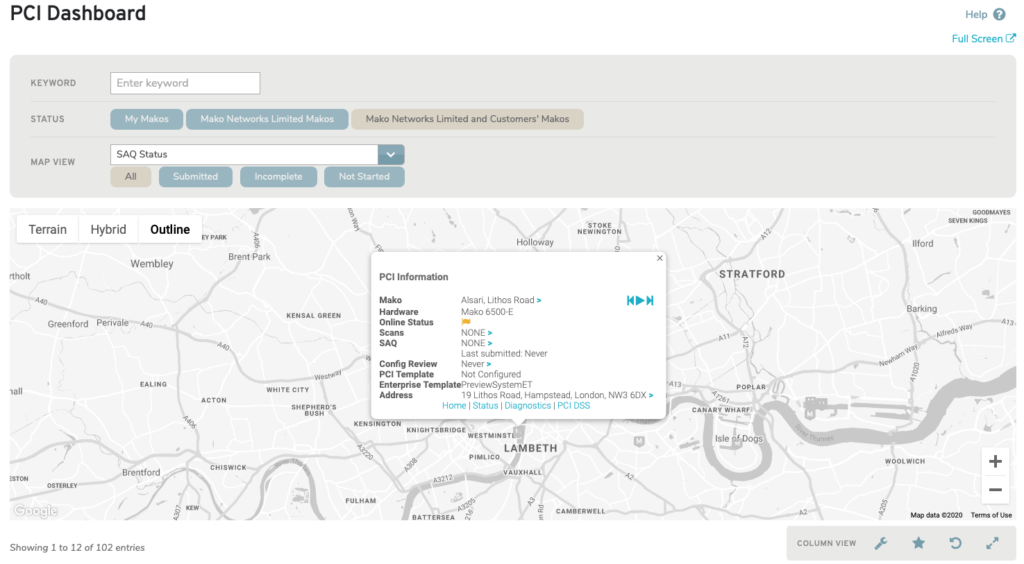
Figure 2. Example PCI Dashboard Map
The PCI Dashboard map interface (Fig. 2) has several different controls and filters available for altering the display of data.
View
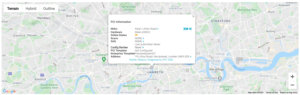
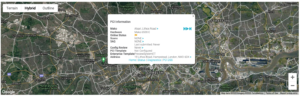
Figure 3. Alternate PCI Dashboard Map Views
The PCI Dashboard map uses a default view of “Outline.” It has alternate views for “Terrain” and “Hybrid” (Fig. 3). Use the buttons at the top left of the map to select the view.
Zoom
Use the “+” and “-” buttons at the bottom right of the map to change the zoom setting of the map.
Recenter
Use the double arrow button below the map to recenter the map around the selected data icon on the map.
Company Filter
Use the status filter above the map view to filter the map data by “My Makos,” “[Company Name] Makos,” or “[Company Name] and customers Makos.”
Icon Filter and Dynamic Filter
First use the Icon filter dropdown above the map to change the type of data that is displayed in the map and to populate the dynamic filter to its left. Then use the dynamic filter links to filter the map data. The data icons on the map are color-coded to match the options in the dynamic filter.
- SAQ Status (Submitted | Incomplete | Not Started | All)
- Scan Status (Pass | Fail | Not Configured | All)
- PCI Template (Applied | Broken | Not Configured | All)
- Online Status (Online | Offline | Configured | Inactive | All)
- Config Review Status (Up to date | Nearly expired | Expired | Not Applicable | All)
- VPN Cloud Status (All Up | Mostly Up | Any Up | Any Down | Mostly Down | All Down | All)
- IPsec Status (All Up | Mostly Up | Any Up | Any Down | Mostly Down | All Down | All)
PCI Dashboard Data List
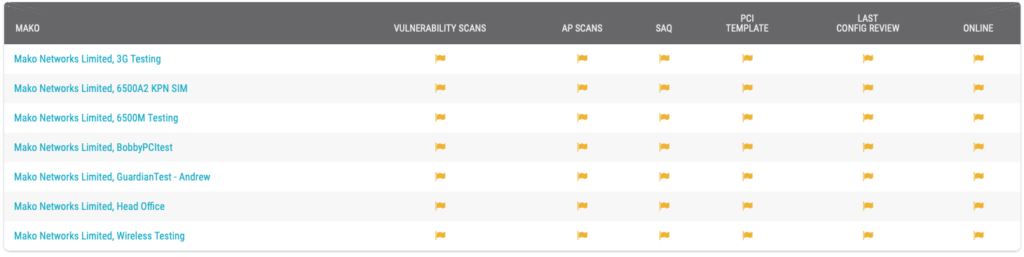
Figure 4. Example PCI Dashboard Data List
The PCI Dashboard Data List (Fig. 4) displays the data shown in the map above.
Search
You can use the Search field at the top of the list to filter the list.
Customize Columns
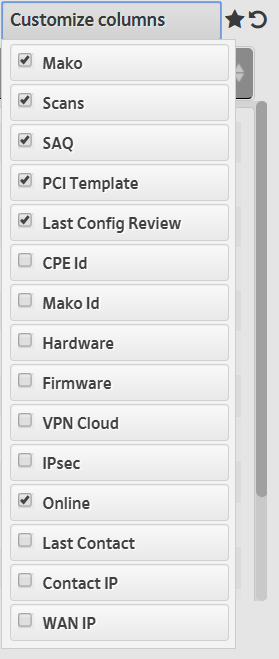
Figure 5. Customize Columns Chooser
The Customize Columns chooser (Fig. 5) allows you to choose which columns to display in the PCI Dashboard Data List. Click the “Customize Columns” button at the top of the list, then use the checkboxes to toggle the display status of each column. Click the “Customize Columns” button again to hide the chooser.
If desired, you can use the “Save Layout” empty star icon button to save the currently selected columns as your preferred layout for the PCI Dashboard Data List. Then whenever you return to this page, your preferred layout will be used instead of the default layout. A filled star icon indicates that the preferred layout is displayed. An empty star icon indicates that a custom layout is displayed.
Use the “Reset Layout” arrow icon button to reset your preferred layout to match the default layout for the PCI Dashboard Data List.