Overview
The Diagnostics page allows you to issue diagnostic commands to the selected Mako and then view the diagnostic results.
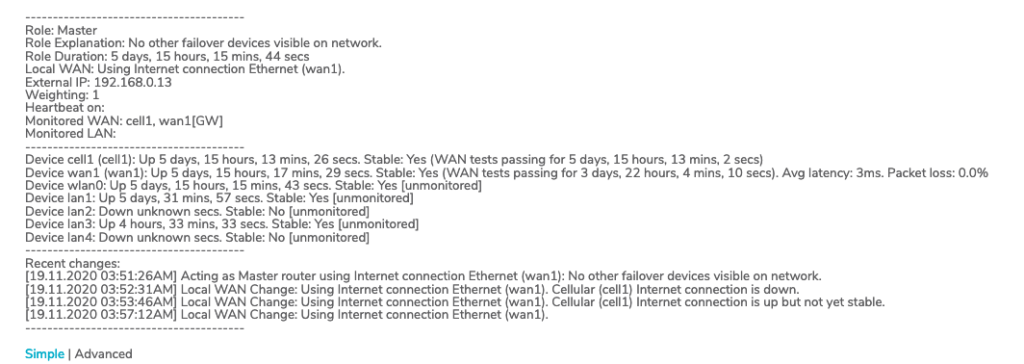
To execute the “Failover Status” diagnostic command, click its radio button in the Command column of the list. The diagnostic results will appear above the list.
Failover Status

Figure 1. Example “Failover Status” Diagnostic Results
The “Failover Status” diagnostic results (Fig. 1) display details regarding the failover behavior of the selected Mako.
Failover Status Details
- Role – role of failover device
- Role Explanation – explanation of role
- Role Duration – length of time spent in role
- Local WAN – local WAN of failover device
- External IP – external IP address of local WAN
- Weighting – weighting or load for local WAN
- Heartbeat on – whether or not device is generating a periodic signal to indicate normal operation
- Monitored WAN – list of WANs being monitored for failover status
- Monitored LAN – list of LANs being monitored for failover status
- WANs – list of WAN devices
- Device – name of device
- Uptime – amount of time device has been up
- Stable – Stability of device
- Avg Latency – average amount of latency experienced by device
- Packet Loss – percentage of packets lost during transmission
- LANs – list of LAN devices
- Device – name of device
- Uptime – amount of time device has been up
- Stable – Stability of device
- Avg Latency – average amount of latency experienced by device
- Packet Loss – percentage of packets lost during transmission
- Recent Changes – list of failover status changes for monitored devices
