Overview
The Diagnostics page allows you to issue diagnostic commands to the selected Mako and then view the diagnostic results.
The “Current Connection” diagnostic command allows you to display all of the selected Mako’s current connections, which can be helpful when troubleshooting network issues.
To execute the “Current Connections” diagnostic command, click its radio button in the Command column of the list. The diagnostic results will appear above the list.
Current Connections
Simple View

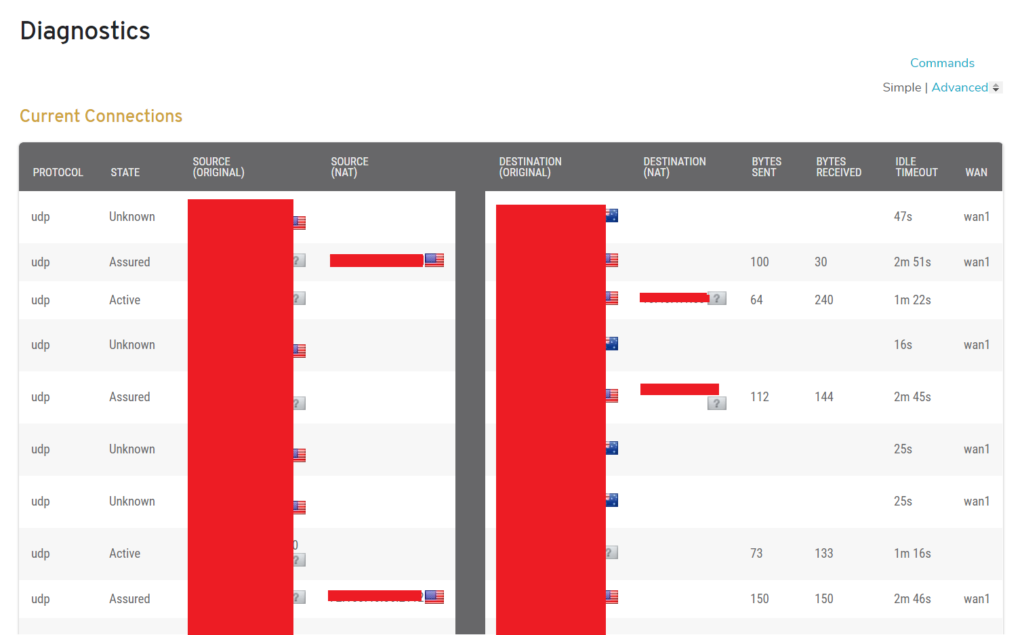
Figure 1. Example Simple “Current Connections” Diagnostic Results
The default view of the diagnostic results is the “Simple” view (Fig. 1). It includes a Current Connections list, a Connections State Summary, and a Connections Top Ports Summary.
Current Connections List
The Current Connections list (Fig. 1) contains information regarding the selected Mako’s current connections.
Columns
- Protocol – type of connection and port used
- State – state of connection
- Source (Original) – source IP address of connection
- Source (NAT) – source NAT address
- Destination (Original) – destination IP address of connection
- Destination (NAT) – destination NAT address
- Bytes Sent -traffic sent by source IP
- Bytes Received -traffic received by source IP
- Idle Timeout – timeout value for the connection if no user data sent/received
- WAN – outbound WAN interface the connection is using (if applicable)

Figure 2. Example Current Connections List Bottom
Click “Show option” at the bottom of the Current Connections list (Fig. 2) to see a column containing minus icon buttons for closing current connections. Use with caution.
Connections State Summary

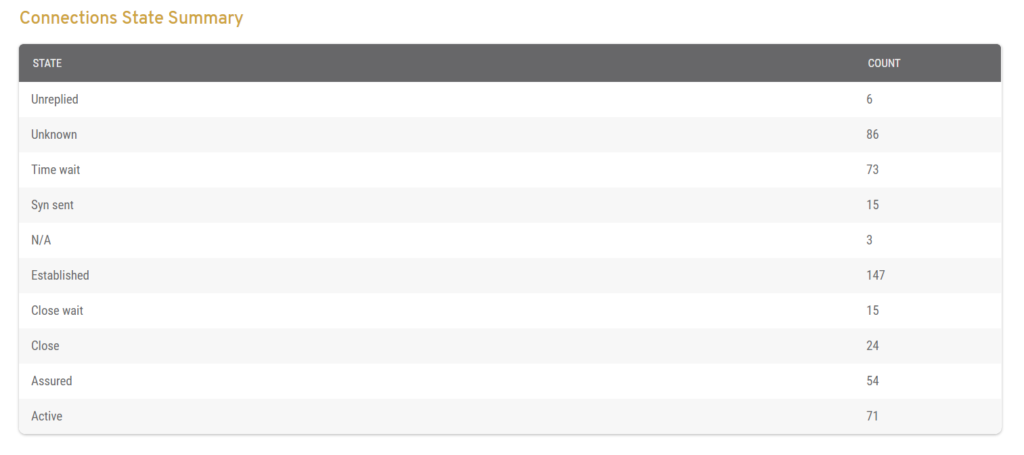
Figure 3. Example Connections State Summary
The Connections State Summary (Fig. 3) lists the connection types of the current connections and displays the number of current connections for each type.
Connections Top Ports Summary

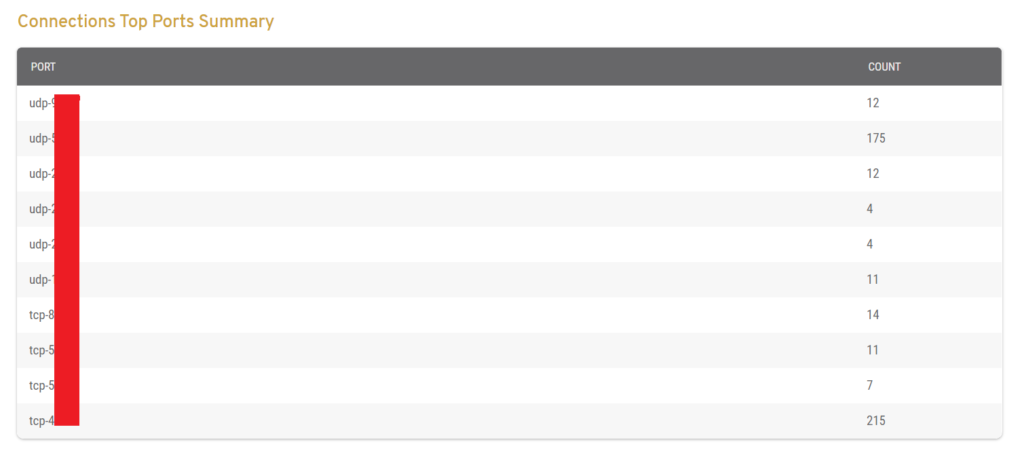
Figure 4. Example Connections Top Ports Summary
The Connections Top Ports Summary (Fig. 4) lists the top ports of the current connections and displays the number of current connections for each port.
Advanced View
There is an “Advanced” link that displays an advanced view of the diagnostic results, which allows you to see the raw data.
