Overview

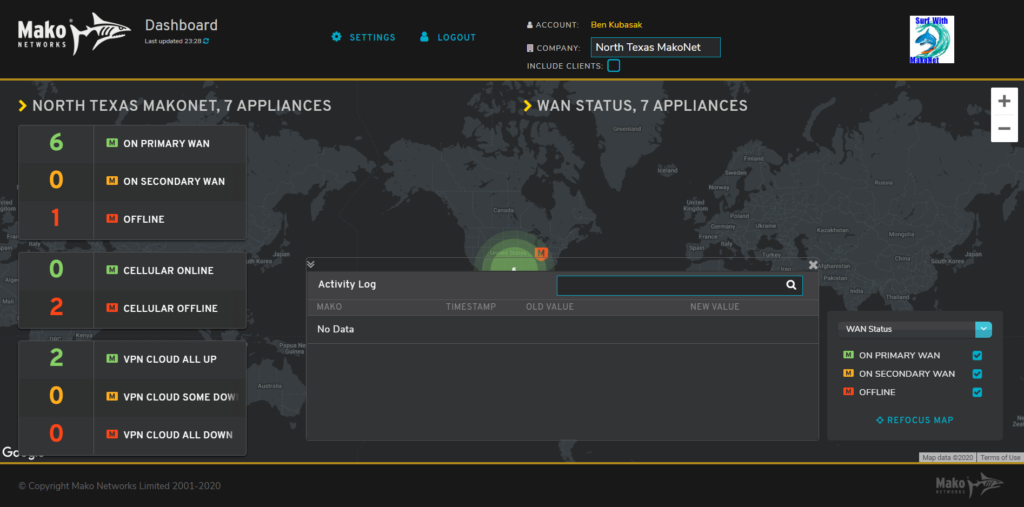
Figure 1. Example Mako Dashboard
Mako Dashboard (Fig. 1) is a secure network visualization tool that gives centralized support teams a way to monitor the status of their entire network at a glance.
Click the Settings link in the header to manage Mako Dashboard settings for your user account.
Settings

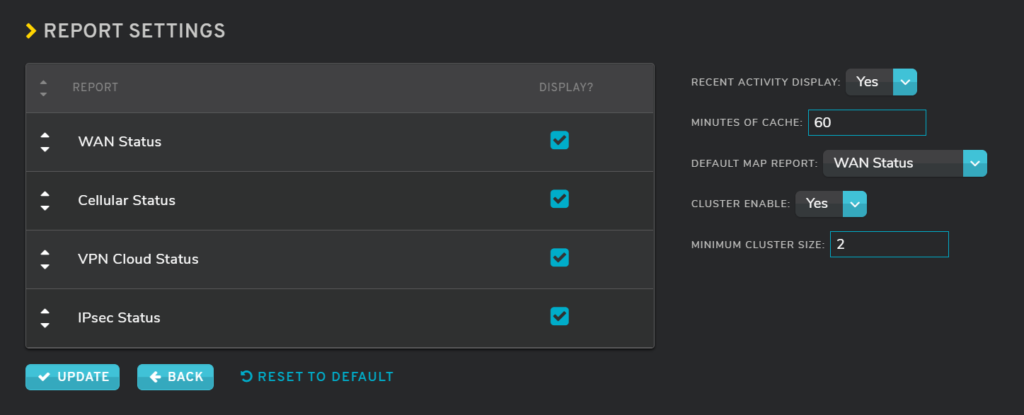
Figure 2. Example Settings Page
Use the Settings page (Fig. 2) to configure Mako Dashboard settings for your user account. Click the “Update” button to save any changes made here.
Report Settings
Choose whether or not each report should display as a summary card in the Company Summary using the checkboxes in the Display column.
Drag and drop the rows to sort the order in which reports appear in the Company Summary. This feature is coming soon.
Recent Activity Display
Choose whether or not to display the Activity Log.
Minutes of Cache
Enter the maximum number of minutes for a user session, i.e. how long a user account can remain logged in to Mako Dashboard.
Default Map Report
Choose which report is the default report shown in the Network Map after logging in.
Cluster Enable
Choose whether or not to enable marker clustering on the Network Map.
Minimum Cluster Size
Enter the minimum number of markers that can be used to create a cluster on the Network Map. If clustering is enabled, this should be set to an integer greater than or equal to 2.
At the default setting of “2,” any two markers within clustering distance of each other will form a cluster. Changing this to “5” would mean a cluster will not be formed until at least five markers are within clustering distance of each other. The clustering distance depends on the current zoom level of the map.
Update Button
Click the “Update” button to save any changes made here.
Back Button
Click the “Back” button to return to the Dashboard page.
Reset to Default Button
Click the “Reset to Default” button to reset all of these settings to their default values. Use with caution, as clicking this button does not ask for any confirmation before resetting and saving all settings.
