Overview
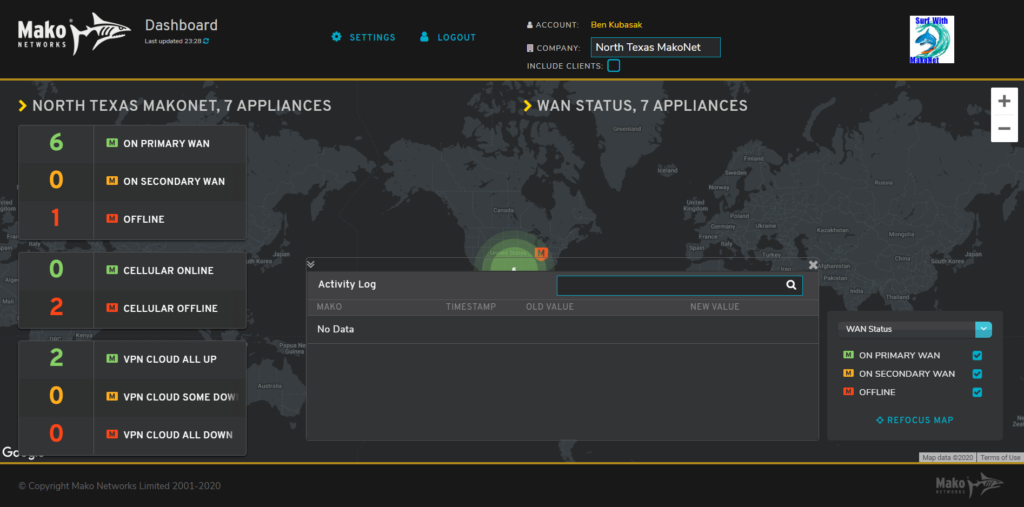
Figure 1. Example Mako Dashboard
Mako Dashboard (Fig. 1) is a secure network visualization tool that gives centralized support teams a way to monitor the status of their entire network at a glance.
Dashboard
Use the Dashboard home page (Fig. 1) to see the status of the selected company’s network at a glance.
Company Summary
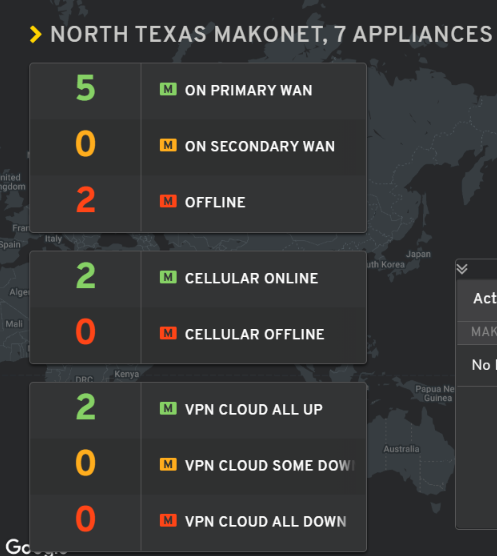
Figure 2. Example Company Summary
The Company Summary (Fig. 2) indicates the name of the selected company, whether or not its clients are included in the data displayed, the total count of active Mako devices, and Summary Cards with additional status information.
Summary Cards
- WAN Status Counts
- ON PRIMARY WAN – devices currently running on primary WAN connection
- ON SECONDARY WAN – devices currently running on secondary WAN connection
- OFFLINE – devices currently without any WAN connectivity
- Cellular Status Counts
- CELLULAR ONLINE – devices currently with cellular connectivity
- CELLULAR OFFLINE – devices currently without cellular connectivity
- VPN Cloud Status Counts
- VPN CLOUD ALL UP – devices currently with full VPN Cloud connectivity
- VPN CLOUD SOME DOWN – devices currently with some VPN Cloud connectivity
- VPN CLOUD ALL DOWN – devices currently without any VPN Cloud connectivity
- IPsec VPN Status Counts
- IPSEC VPN ALL UP – devices currently with full IPsec VPN connectivity
- IPSEC VPN SOME DOWN – devices currently with some IPsec VPN connectivity
- IPSEC VPN ALL DOWN – devices currently without any IPsec VPN connectivity
Summary Card data rows are color-coded in green, yellow, and red, which indicate desirable, mixed, and undesirable status options respectively.
Detail View
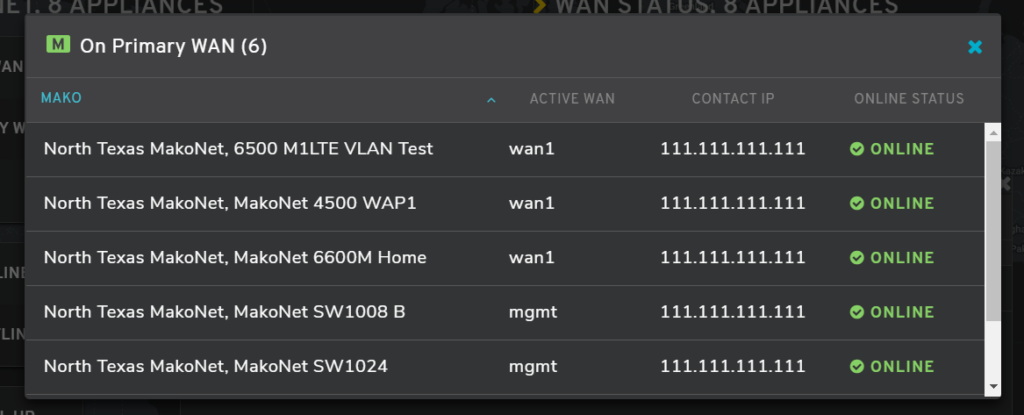
Figure 3. Example Summary Card Detail View
Clicking on a data row in a Summary Card opens a Detail View panel (Fig. 3) that lists all the devices counted for that data row. Use the table column headings to sort these devices. Use the “x” icon button to close the panel.
Network Map
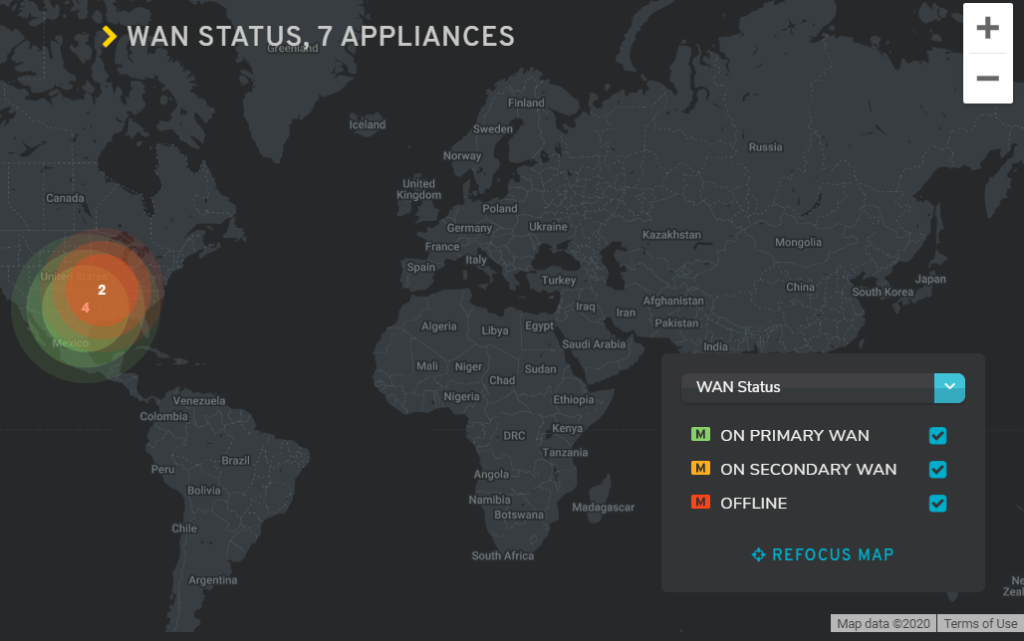
Figure 4. Example Network Map
The Network Map (Fig. 4) displays clustered, color-coded pin markers that represent the selected company’s Mako devices. The data that is displayed on the map depends on the selected Network Map Filter values.
Marker Clustering
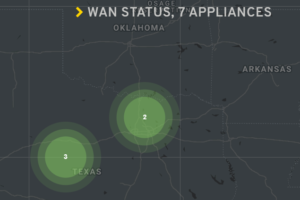
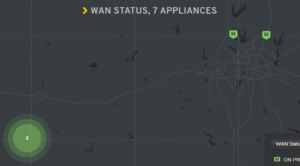
Figure 5. Marker Clustering Examples
Marker clustering replaces groups of individual markers on the map with circular clusters that display the number of markers in that local region of the map. As you zoom in or out, the clustering changes to match the scale of the map.
In the example above (Fig. 5), the user sees a cluster containing two devices, then the user zooms in and sees the two previously clustered markers have split into individual markers at this new scale. A cluster containing three markers is also shown, but given the marker positions and the zoom levels of the map, they remain clustered at the scales shown.
Marker Detail View
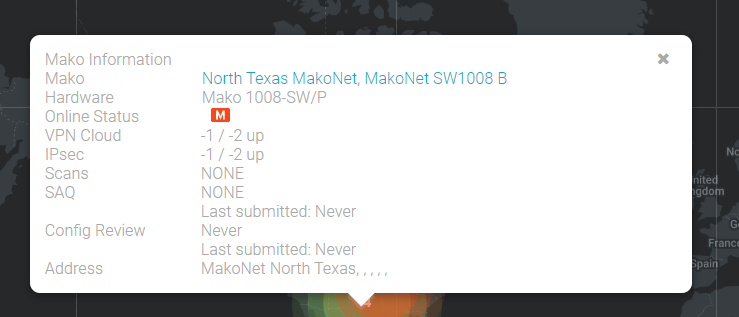
Figure 6. Example Marker Detail View
Click a marker on the map to view detailed information regarding the Mako device represented by the marker (Fig. 6). Click the name of the Mako to view it in the Mako CMS.
Network Map Filter
The Network Map Filter has two parts: a dropdown for selecting the dataset to use and a dynamic checkbox list that allows you to choose which status options within the dataset should display. The list below shows the dataset options (top level) and their related status options (second level).
- WAN Status
- ON PRIMARY WAN – devices currently running on primary WAN connection
- ON SECONDARY WAN – devices currently running on secondary WAN connection
- OFFLINE – devices currently without any WAN connectivity
- Cellular Status
- CELLULAR ONLINE – devices currently with cellular connectivity
- CELLULAR OFFLINE – devices currently without cellular connectivity
- VPN Cloud Status
- VPN CLOUD ALL UP – devices currently with full VPN Cloud connectivity
- VPN CLOUD SOME DOWN – devices currently with some VPN Cloud connectivity
- VPN CLOUD ALL DOWN – devices currently without any VPN Cloud connectivity
- IPsec VPN Status
- IPSEC VPN ALL UP – devices currently with full IPsec VPN connectivity
- IPSEC VPN SOME DOWN – devices currently with some IPsec VPN connectivity
- IPSEC VPN ALL DOWN – devices currently without any IPsec VPN connectivity
- Overall VPN Status – combines the previous two datasets (VPN Cloud and IPsec)
- VPN ALL UP – devices currently with full VPN connectivity
- VPN SOME DOWN – devices currently with some VPN connectivity
- VPN ALL DOWN – devices currently without any VPN connectivity
The title of the Network Map indicates the selected dataset option and the total count of devices in that dataset.
Status filter options are color-coded in green, yellow, and red, which indicate desirable, mixed, and undesirable options respectively. The pin marker data points on the Network Map use these same colors, as well.
Zoom
Use the “+” and “-” buttons at the top right of the map to change the zoom setting of the map.
Refocus Map
Use the “Refocus Map” button below the map filter to recenter the map around the center of the selected dataset.
Activity Log
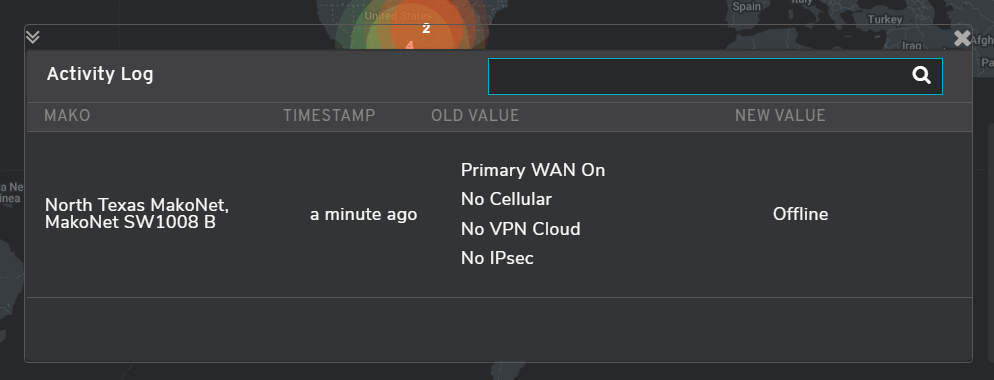
Figure 7. Example Activity Log
The Activity Log (Fig. 7) summarizes changes to each Mako device by tracking key data fields that affect the Mako’s status in the Mako Dashboard visualizations. When any of these values change for a Mako an event is logged.
When you first load the Activity Log, it will not show any data. As changes occur to Mako devices in the estate shown, events will appear in the Activity Log.
Show/Hide
Click the down arrows icon at the top left of the Activity Log to minimize it. You can maximize it again by clicking the up arrows icon on the minimized Activity Log.
Close
Click the “x” icon at the top right of the Activity Log to close it. You can display it again by visiting the Settings page.
Search Filter
Use the search filter at the top of the Activity Log to filter the results using text keywords.
Columns
- Mako – name of Mako devices that logged the event
- Timestamp – when the event occurred
- Old Value – set of Mako status data from before the event
- New Value – set of Mako status data from after the event