This is the online user manual for Mako Dashboard, a secure network visualization tool that gives centralized support teams a way to monitor the status of their entire network at a glance.
Overview

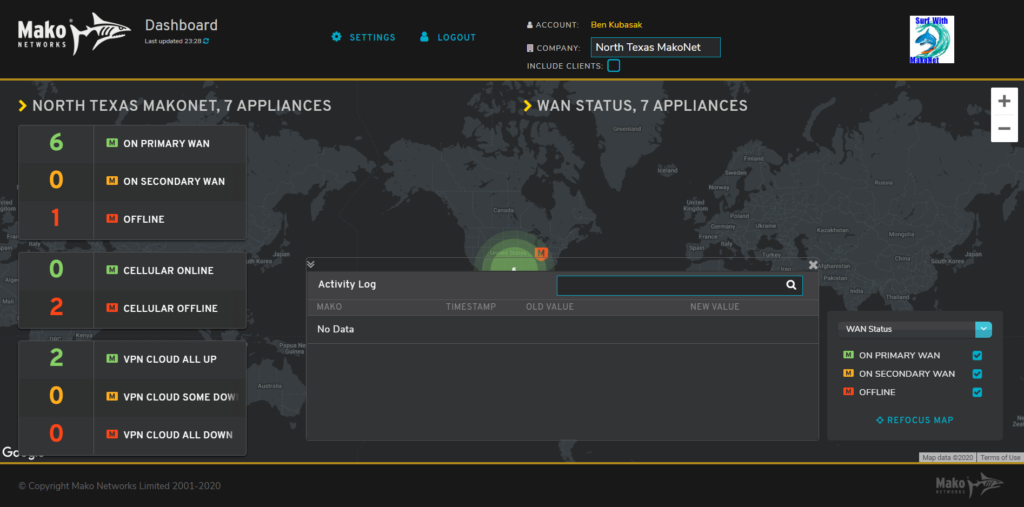
Figure 1. Example Mako Dashboard
Mako Dashboard (Fig. 1) is a secure network visualization tool optimized for display on large monitors or HDTVs in network operations centers that gives centralized support teams a way to monitor the status of their entire network at a glance and to respond proactively to network events as they arise in real time.
Mako Dashboard is a cloud-based tool that is accessible from the Mako Central Management System (CMS) via single sign-on (SSO) integration. Both applications handle data securely in compliance with PCI DSS requirements.
When loading large datasets in Mako Dashboard, you may see a loading message while your data is retrieved.

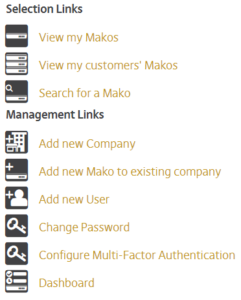
Figure 2. Example Mako CMS Home Page Quick Links
To access Mako Dashboard, click the Dashboard link in the Management Links quick links on the Mako CMS Home page (Fig. 2). Other links to Mako Dashboard may be available in the Mako CMS layout and navigation in the future.
Single Sign-On
Because you are logged in to the Mako CMS, and the Mako CMS and Mako Dashboard are integrated using SSO technology, you should be able to access Mako Dashboard without logging in again. If you attempt to access Mako Dashboard directly and you are not currently logged in, you will be redirected to the Mako Networks home page for security purposes. Visit the Mako CMS to log in again.
Mako Dashboard user sessions can last longer than Mako CMS user sessions, so you may not need to log in to the Mako CMS every time you visit Mako Dashboard.
Header

Figure 3. Example Header
The header region of the site (Fig. 3) contains basic information and actions for site users.
Mako Dashboard Information
The logo and title of the site appear along with a message indicating the last time Mako Dashboard successfully retrieved data from the Mako CMS.
Home Link
Click the Mako Networks logo on the left side of the header to return to the home page from anywhere in the site.
Refresh Data
Click the blue circular arrows icon button next to the Last Updated message to manually request that the data be refreshed. Under normal operation, the data should refresh automatically once per minute.
User Account Information
Your full name from your user account appears here.
Settings Link
Click the Settings link to manage Mako Dashboard settings for your user account. See the Settings page section below for more information.
Logout Link
Click the Logout link to end your current user session for both Mako Dashboard and the Mako CMS.
Selected Company Information
The logo and name of the selected company appear here.
Change Company
Enter the name of one of your companies. As you type, valid matching options will be suggested to you. Choose the company whose data you would like to view.
Include Clients
After choosing a company, use this checkbox to specify whether or not to include data from that company’s child companies (clients) in the data that displays.
Dashboard
Use the Dashboard home page to see the status of the selected company’s network at a glance.
Settings
Use the Settings page to configure Mako Dashboard settings for your user account.
